
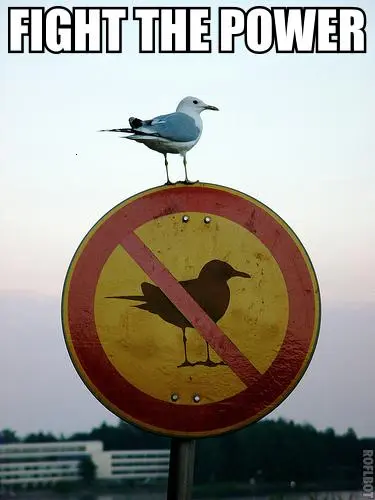
23·
10 months agoCalling this genocide dilutes the importance of the word
Calling this genocide dilutes the importance of the word

I get unlimited skips on Spotify web desktop
For mobile i used to use a cracked version
Meant cook county, no need to be a jackass, jackass
But the article specifies chicago area, ie cook county which votes blue
Edited for semantics
Illinois has been voting blue since 1992, the current president is a Democrat, what does this have to do with republicans?
Sea wind blows to where? Who knows

What about diffraction?
I can be rich but if I know how to shake a vending machine for free food I’ll do it
The end of the gold standard in 1971
Dies at 46 after a minor cut gets infected
If piracy is moral and ethical and enables us to share knowledge, why do private trackers gatekeep this knowledge?
Because thats not how most people see it. It’s just a way to watch movies (or download stuff) for free. Private trackers ensure a higher quality experience
Piracy isn’t some high philosophical debate, it’s seeing something you want and making a copy of it.
Holy shit dude you are awesome, thanks alot!
In this case the jpegs themselves change everytime you zoom in, so you zoom in a little it loads a new set of higher quality Jpegs.
Do you remember the tool you are talking about?
Try torrenting on another device (like your phone) to see if the issue is your network. Also try a non qbittorent client
Op:
but even with the VPN disabled it doesn’t work.
Comments:
Have you tried changing your vpn???
The means of production are not entirely owned by a seperate class nor is the barrier to entry for many industries so high that it is entirely impossible for the average joe to enter.
Sure some industries are nigh impossible to get into, like pharmaceuticals for example, there are much bigger industries that have lower barriers like machine shops (which are really medium entry but you can scale them), and manufacturing via 3d print hubs.
Not to mention aoftware development which is a fucking wonder when it comes to potential money vs barrier to entry.
Certain construction contractors and engineering consulting firms can be opened up with fairly low barrier to entry.
I’m sleepy so my replies may not seem very coherent so tell me if you don’t understand what im saying

Ninja 400 for 6000 and that’s basically the honda civic of motorcycles. Very reliable even after being crashed multiple times
First season doesn’t have frank reynolds/danny devito so maybe that’s why


Although the bar chart is objectively better, especially the 3d ones, the pie chart is more intuitive and simpler to understand for a lot of people.
A halfway point in between is the tree map chart example
The color blindness problem can mostly be avoided. The tiny slices issues can be present in all three including the bar chart, for example if we have this data (these are percentages): 50 30 18 0.5 0.3 0.2 etc… The final bar chart would be either too long or too squished.
In a tree map chart, by moving the data/squares around you can avoid the problem of the squares being squished which the author is complaining about